|
Trend trading to win
FACT: Stock Market trends only occur about 20% to 25% of the time. If you can not properly identify a trend, your chances are high that you will enter a trade at the top of a trading range. Losses will follow. Up, down or sideways? If you are trend trading to win and you fail to implement this trend trading system, the results may be disappointed at the results. You’ve probably heard the saying, “All is fair in love and war”. This being the case, we don’t want to take anything for granted on the financial battle field, because it’s the attack ( the trend ) you don’t see coming that will devastate you. So while the tendency is to be focused on where to find potential profit, we also want to be looking in all directions for potential trouble, especially before entering a trade. At this time we are only going to cover one of those directions, that being where the security is headed, so we can be sure to trade with the trend. Many well know traders, such as Michael Parness make their living trading trends. It sounds simple, and it usually is from the left side of a chart. I say usually, because even when a well established up trend is observed on a chart, while the price may still be moving up today, the current beneath the surface may indicate a change is heading our way fast! Besides, we have to trade from the right side of the chart anyway, and as you no doubt would agree, that is a bit more challenging to work with. With a little trading insight however, you can be identifying stock trends like a pro in no time.
RSI, The Secret Weapon For Trend Trading Before you go jumping to any conclusions, read this through. There are many uses for RSI (Relative Strength Index). The way we are going to put it to work here might be considered by some, to be upside-down, as many consider a high value of RSI as an indicator to exit and a low the value to enter. This really is a scientific way to identify a stock trend though. The key to our success in using RSI, is to ignore this view point and to utilize dynamic support and resistance points, as opposed to trading with blinders on using the standard 70/30 or 80/20 limits. As securities flow and ebb our reactions to the changing RSI values must accordingly be different. We are not going to make a prediction or forecast a stock trend, but we are going to use RSI to tell us whether or not a trend is occurring, and if so, which direction it is going. You can do this simply by observing an RSI window under your price chart. The preferred method though, is building your own indicator, if you have charting software that allows you to, so that you end up with an easy to view window that simply indicates up, down or trading. If your charting software doesn’t allow you to build your own indicators, I highly recommend Amibroker. It is inexpensive compared to most and is extremely versatile. Here is a link to the site, if you would like to check it out yourself. http://www.amibroker.com.
Up Trend For starters, we will use a 9 period RSI. The first step is to determine how many periods have passed since the RSI went above 70 and how many periods have passed since it went below 30. If there have been fewer periods since it was above 70, then we check to see if the lowest value of RSI since that point is still above 40. If this is the case, then we have a confirmed up trend. It began when the RSI value first exceeded 70 and continues so long as the lowest RSI value stays above 40.
Down Trend To identify a down trend, again we use a 9 period RSI. Then we determine how many periods have gone by since the RSI went above 70 and how many periods have passed since it went below 30. If there have been fewer periods since it was below 30, then we check to see if the highest value of RSI since that point is still below 60. If this is the case then we have a confirmed down trend. It began when the RSI value first fell below 30 and continues so long as the highest RSI value stays below 60.
Trading Range The trading range is simple to detect. We find it be default. When an up trend ends, but a down trend is not detected by the above criteria, a trading range has been established. Of course, the opposite is true too. When a down trend ends, but an uptrend does not show itself, a trading range has been established.
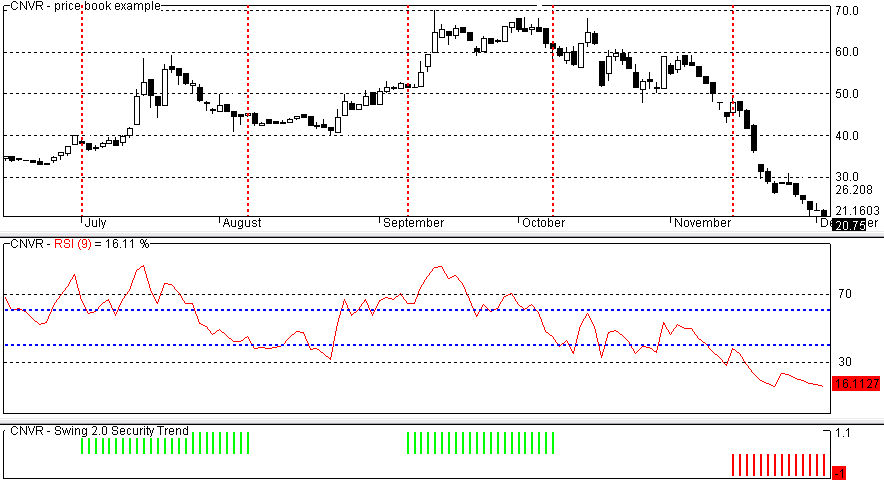
A Picture is Worth a Thousand Words; note in the RSI window, the 70 and 30 lines are marked. The two blue lines are 60 and 40 respectively.
The bottom window displaying green and red vertical bars indicate up and down stock trends respectively. The same window, when neither green or red bars are present, indicate a trading range. These bars are based upon the RSI requirements we have noted above. The center window is the corresponding 9 period RSI indicator with 70/30 limit lines. Lastly, the top window indicates price movement. The vertical yellow dotted lines were inserted to easily note where the trend indicating bars start and stop. Notice how each time the trend indicating bars precede significant price movements in the stock, allowing you to take advantage of them. Additionally, when no trend bars are present (a trading range), no significant price movement occurs in the stock. Imagine the advantage you would have over other traders in the market if you know beforehand the trend in a stock was about to shift! If you use Amibroker charting software as I do, then you may copy and paste the formula below into your indicator builder to create a trend indicating window as you see above. If you use other charting software, then you would need to write your own formula based on the criteria stated above. Or if you must, you can decipher the trend / trading condition simply by viewing an RSI window, although as you can see above, this necessitates more scrutinizing.
Amibroker formula Aup=40;//40 Adown=60;//60 up=BarsSince(RSI(9)>70); down=BarsSince(RSI(9)<30); Graph0=IIf(up<down,1,-1); Graph0Style=2; Graph0BarColor=IIf( up<down AND LLV(RSI(9),up)>Aup ,5,IIf(down<up AND HHV(RSI(9),down)<Adown,4,0)); Graph1=1.1; Graph1Color=0; Graph2=-1.1; Graph2Color=0;
The “Graph1” & “Graph2” section of the formula is only to keep the indicator scaled properly. If you use other software, you may find that portion is not necessary. Set up this indicator and view several charts. I’m sure you’ll be very pleased with the additional information it provides you with, whether you are interested in trend trading stocks, commodities, or forex. If you are new to trading, PLEASE don’t go trading using only this trend indicator! Those of you who are experienced I’m sure will understand. You can’t for example, enter just any old place during a trend for example and expect to exit with a profit simply because you exited later in the trend! This is simply part of your arsenal. It is certainly a valuable part, no matter what method of trading you are using, but you still need and entry and exit strategy. Essential to all successful trading strategies is sound money management. Remember: Trend trading can be disastrous if you fail to implement this stock trading strategy. If you would like to learn more secrets to profitable trading, then enter your name and email address below and we'll be glad to share other trading tips and resources with you.
All email addresses are kept confidential and are never shared with anyone.
KNOWLEDGE IS POWER
Terms and Conditions / Risk Disclosure online stock trading | stock market trading Copyright 2006, All Rights Reserved; trend trading |